Fluent .NET Engine Performance Analysis
This article describes how to run performance tests using either our .NET or Java Report Engines. Windward's engines are fast, very fast. The number one thing that we hear from our clients moving to Fluent from competing solutions is the performance gain they receive. We realize that running performance tests under ideal conditions are not always reflected in real environments. We routinely update the performance PDF and this article with the latest versions of our Report Engine benchmarks. However, we also provide this performance test as a part of our Report Engine software package in both demo and production versions. We encourage you to test the Fluent Report Engine in your own environment to see how it performs before you purchase.
The steps below will outline how we test our product internally and how you can run these tests for yourself in your own environment. As always, we are curious to know your results and are always interested to see how our product performs in different environments. If you would like assistance running these tests and are willing to share your results then please feel free to contact us at support@windwardstudios.com and our Marketing team will reach out to you.
Download the Full Report here: Fluent Engine Performance.pdf
Engine output performance when measured in pages per second is highly dependent on the amount of data on each page. In general a page with twice as much data can take up to twice as long to generate output.
What does this Article Cover?
- The Numbers - the latest performance analysis report for the current version of the Fluent Engine
- The Measurement System - Here we will explain how we run our tests including hardware specifications, template size, output size and data source details.
- How do I run the Tests?
The Numbers
The below tests all use the files in WindwardPerformance.zip
- The OData Server contains the Northwind database. The database server is located in the cloud.
- The JSON file is a 1.27M file which contains a dump of the SQL Server Northwind database. The file is on the local machine.
- The SQL Server contains the Northwind SQL database. The database server is located on the test machine.
- The XML file is a 1.35M file which contains a dump of the SQL Server Northwind database. The file is on the local machine.
- The template is 2 pages long and the report it generates is 17 pages long and is run 50 times.
The Measurement System
For this latest version of the Fluent Report Engine, we tested the performance by creating a report 50 times and averaging the result. Performance results (number of pages created per second [PPS]) depended on which engine is used, what sort of data source is used, and the number of simultaneous threads called by the Fluent application.
- Processor: Intel® Xeon® E5520 @ 2.27GHz 8 virtual processors
- Memory: 32.0 GB
- Operating system: Windows Server 2016 Standard 64-bit
- The Fluent AutoTag template is a Microsoft® Word document two pages long. It contains text, images, headers, footers, multiple loops, and equations.
- The generated report is a 17-page Word document (DOCX). The number of pages generated per second is not affected by the output format. Both DOCX and PDF reports were generated in the same amount of time. The report is run 50 times for each test.
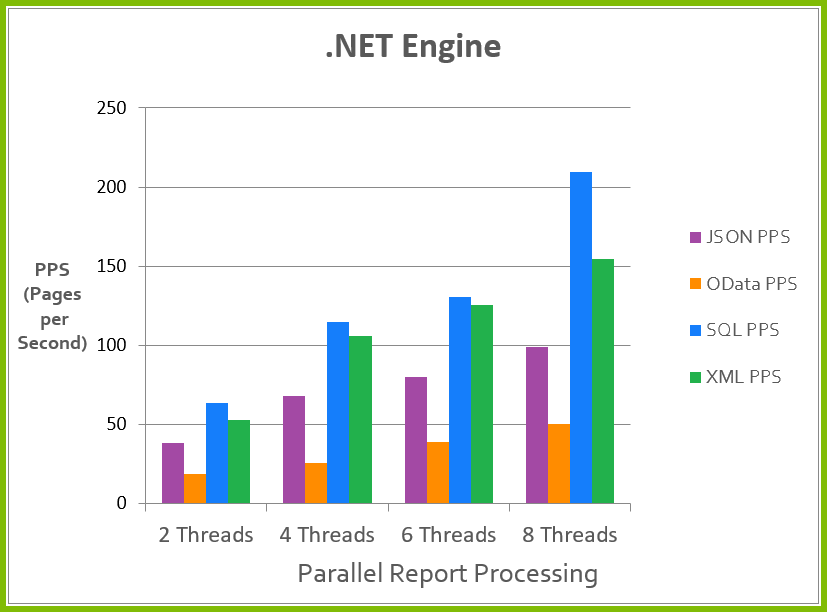
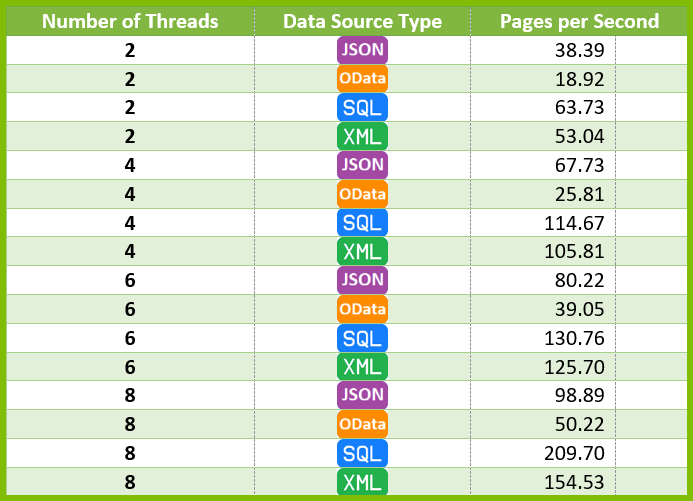
The Fluent .NET Report Engine
For each test of the .NET Report Engine, we ran with four data sources (JSON, OData, SQL, and XML) and four different thread counts (2, 4, 6 and 8 threads). The exact results are listed in the table below.
*Running on an Intel® Xeon® E5520 @ 2.27GHz with 32 GB RAM on Windows Server 2016 Standard (64-bit)
Testing Notes
These Report Engine performance tests assume the worst case performance in several aspects, so your performance could easily be faster.
In this test:
- We open the template each time the Engine generates a report. When you run the same template in bulk through the Fluent Engine, it scans the template one time and caches it. This results in a speed increase as the time to read the template are removed from each successive run.
- The data sources are loaded again each time, which may not be necessary in your use case.
- Both DOCX and PDF reports were generated in the same amount of time.
A Note about processor thrashing
We ran these tests on a 4 core system. Typically we recommend that you do not exceed 2 times the number of total cores on your target system. You will notice in most of the tests above that performance starts to plateau after 8 threads (2 x 4 cores = 8 threads). This is a result of a phenomena called processor thrashing which is a state where the processor performs less productive work and more work swapping between all simultaneously running processes or threads. This yields diminishing returns over time as the processor is spending more time trying to manage all simultaneous processes than actually processing them.
How Do I Run the Tests?
The -performance:1234 option is available in the sample RunReport application shipped with both the .NET and Java engines. We strongly recommend that you run this program using your sample sets of templates and data on the server you will use.
One of the key factors to the performance of generating reports is based on the hardware being used. The greater the processing power and the larger memory your system has will translate into improved performance of generating reports. That being said, here are some important stats to know in regards to generating reports.
There are a couple of generalizations we feel safe making about Fluent Reports:
- Its performance time is linear. It will take 10x longer to run 100,000 reports than it takes to run 10,000 reports.
- For every CPU core, you should generally have a maximum 2 threads generating reports.
- Its memory usage is constant. Running 1,000 reports uses the same amount of memory as running 100,000 reports.
- DOCX, XLSX, PPTX, PDF, HTML, and TXT reports all take about the same time.
- File I/O is a big part of the time required.
- Logic commands are the most expensive computationally. IF/ELSE and SWITCH/CASE statements, when used excessively, will slow down your report generation (this is only noticeable if you have more than 150 tags of this type in a single template)
Performance Analysis Commands
Clone our sample repository
Open the solution in fluent-code-samples\Embedded .NET Engine Samples\Advanced\GenerateAnyDocumentCommandLine
Run program.cs with the arguments below.
TEMPLATE_NAME OUTPUT_NAME DATA_CONNECTION –performance:NUM_REPORTS –threads:NUM_THREADS
Example
This example will run the template 10,000 times using 4 simultaneous threads to generate the reports in parallel.
"Looping Variable Invoice Sample - XML.docx" testreport.docx -xml:XML "Southwind - Data.xml" -performance:10000 -threads:4
RunReport.exe command options
When executing the RunReport program from the command line of the Fluent Engine with no parameters you will see the following output below will all options that can be used.
usage: RunReport template_file output_file [-basedir path] [-xml xml_file | -sql connection_string | -sforce | -oracle connection_string | -ole oledb_connection_string] [key=value | ...]
   The template file can be a docx, pptx, or xlsx file.

   The output file extension determines the report type created:

       output.csv - SpreadSheet CSV file

       output.docm - Word DOCM file

       output.docx - Word DOCX file

       output.htm - HTML file with no CSS

       output.html - HTML file with CSS

       output.pdf - Acrobat PDF file

       output.pptm - PowerPoint PPTM file

       output.pptx - PowerPoint PPTX file

       output.prn - Printer where "output" is the printer name

       output.rtf - Rich Text Format file

       output.txt - Ascii text file

       output.xhtml - XHTML file with CSS

       output.xlsm - Excel XLSM file

       output.xlsx - Excel XLSX file

   -basedir - will set the base directory to this.

   -data filename.xml - will write data.xml to this filename.

   -embed - will embed data.xml in the generated report. DOCX, PDF, PPTX, & XLSX only.

   -launch - will launch the report when complete.

   -performance:123 - will run the report 123 times.

        output file is used for directory and extension for reports

   -cache - will cache template & datasources, will write output to memory stream. Only used with -performance.

   -threads:4 - will create 4 threads when running -performance.

   -verify:N - turn on the error handling and verify feature where N is a number: 0 (none) , 1 (track errors), 2 (verify), 3 (all).  The list of issues is printed to the standard error.

   -version=9 - sets the template to the passed version (9 in this example).

   encoding=UTF-8 (or other) - set BEFORE datasource to specify an encoding.

   locale=en_US - set the locale passed to the engine.

   pod=pod_filename - set a POD file (datasets).

   username=user password=pass - set BEFORE datasource for database connections.

   The datasource is identified with a pair of parameters

       -json filename - passes a JSON file as the datasource

           filename can be a url/filename or a connection string

       -odata url - passes a url as the datasource accessing it using the OData protocol

       -sforce - password should be password + security_token

       -sharepoint filename - passes an xml file as the datasource reading it with the SharePoint FBA protocol

       -xml filename - XPath 2.0 passes an xml file as the datasource

            -xml xmlFilename=schema:schemaFilename - passes an xml file and a schema file as the datasource

           filename can be a url/filename or a connection string

       -xpath filename - uses the old XPath 1.0 datasource.

            -xml xmlFilename=schema:schemaFilename - passes an xml file and a schema file as the datasource

           filename can be a url/filename or a connection string

       -db2 connection_string ex: server=localhost;database=SAMPLE;Uid=test;Pwd=pass;

       -excel connection_string ex: Provider=Microsoft.ACE.OLEDB.12.0;Data Source=c:\test1.xlsx;Extended Properties="Excel 12.0 Xml;HDR=YES"

       -mysql connection_string ex: server=localhost;database=sakila;user id=test;password=pass;

       -odbc connection_string ex: Driver={Sql Server};Server=localhost;Database=Northwind;User ID=test;Password=pass;

       -oledb connection_string ex: Provider=sqloledb;Data Source=localhost;Initial Catalog=Northwind;User ID=test;Password=pass;

       -oracle connection_string ex: Data Source=localhost:1521/HR;Persist Security Info=True;Password=HR;User ID=HR

       -sql connection_string ex: Data Source=localhost;Initial Catalog=Northwind;Integrated Security=SSPI;

       -postgresql connection_string ex: HOST=localhost;DATABASE=pagila;USER ID=test;PASSWORD=test;

           if a datasource is named you use the syntax -type:name (ex: -xml:name filename.xml)

   You can have 0-N key=value pairs that are passed to the datasource Map property

        If the value starts with I', F', or D' it parses it as an integer, float, or date(yyyy-MM-ddThh:mm:ss)

        If the value is * it will set a filter of all

        If the value is "text,text,..." it will set a filter of all